Safe Drinking Water from Source to Tap: Understanding the Water Safety Chain
Introduction
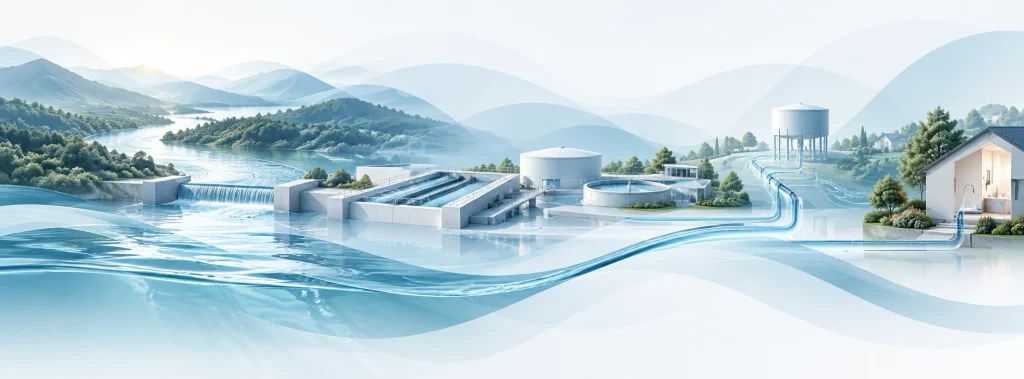
A laboratory result is valuable evidence, but it is not the same thing as a guarantee that a drinking water service is continuously safe. A sample represents water collected at a particular location, on a particular date, under particular operating conditions. Between a river, aquifer or spring and the glass of water used by a household, the water may pass through abstraction works, treatment processes, pumping stations, storage reservoirs, distribution pipes, rooftop tanks and household containers. Each stage may reduce risk, introduce risk or allow an earlier problem to reappear. The central public health principle is therefore that water safety is a property of a functioning system rather than of an isolated sample. The World Health Organization, or WHO, places preventive risk management from catchment to consumer at the centre of its drinking water guidance and combines this approach with health based standards and independent surveillance. Its 2026 drinking water guidelines continue that framework, while its specific 2024 guidance for small supplies emphasises water safety planning, sanitary inspection and progressive improvement. [1] [2]
This distinction matters because apparently reassuring and apparently alarming results can both be misinterpreted. A treatment plant may produce water of acceptable quality while contamination later enters through a damaged distribution system, a poorly covered storage tank or unsafe household handling. Conversely, contamination detected at an untreated source does not prove that consumers receive the same concentration after effective treatment. Proper investigation requires researchers and operators to locate the problem within the supply chain and determine whether the barriers designed to control it are functioning. International monitoring has also moved beyond simply asking whether people use an “improved” source. The WHO and UNICEF Joint Monitoring Programme defines safely managed drinking water by considering whether an improved source is located on premises, available when needed and free from specified contamination. The 2025 global update reported that 2.1 billion people still lacked safely managed drinking water in 2024, illustrating why service reliability and water quality must be analysed together. [3]
Core analytical question
Instead of asking only, “Did the sample pass?”, a stronger investigation asks: What can fail, where can it fail, what barrier is supposed to prevent that failure, how is the barrier monitored, and who is responsible for acting when the control is lost? This formulation connects laboratory evidence with engineering, management, public health surveillance and institutional accountability.
What water safety means
Water safety is often reduced to the concentration of a list of physical, chemical and microbiological parameters. Those parameters are essential, but they form only one dimension of a safe service. A sustainable drinking water system must provide water of suitable quality in sufficient quantity, at a level of availability that does not force households to rely on unsafe alternatives, and through infrastructure that can be operated and maintained over time. The international concept of a safely managed service therefore joins quality, accessibility and availability. This is important in settings where a piped connection exists but water arrives for only a few hours, forcing households to store large quantities. Storage may be necessary, but it creates another point at which contamination can occur. A connection on paper should therefore not be assumed to represent the same public health condition as continuously available water of verified quality. [3]
The practical method is to convert the supply into a process map. Researchers should identify the catchment, source type, abstraction arrangement, treatment steps, treated water reservoir, distribution zones, local storage and points of consumption. They can then create a hazard register for each stage. For a surface source, plausible hazards may include faecal pollution, agricultural runoff, sediment loading and industrial discharges. For groundwater, the priority may include naturally occurring arsenic, fluoride, iron, salinity or contaminants arising from local land use. Within treatment works, risks may arise from incorrect chemical dosing, filter failure, insufficient disinfection contact, equipment malfunction or inadequate operator response. Within a distribution network, pressure loss, leakage, cross connections and stagnant sections may become important. At household level, the condition of containers, rooftop tanks and point of use devices matters. The system map prevents a technically attractive intervention from being mistaken for the correct intervention merely because it is available.
Interpret microbial, chemical and physical parameters using the applicable standard, analytical method, sampling location and exposure context.
Interruption may create hydraulic risks and may also encourage household storage or use of less protected supplementary sources.
A treatment technology is useful only when operators, energy, consumables, maintenance, monitoring and repair arrangements remain available.
What the evidence shows
Microbial contamination remains a major drinking water health concern. WHO has repeatedly identified faecal contamination as a serious risk because contaminated water can transmit diarrhoeal disease and other infections. [4] Yet microbiological contamination is frequently intermittent. A pipe break, heavy rainfall event, loss of disinfectant residual, pump failure or unsafe handling episode may occur between scheduled sample dates. A negative result therefore means that the target organism or indicator was not detected under the conditions and analytical sensitivity of that particular test. It does not establish that contamination never occurs. This explains why contemporary water safety management combines end point testing with operational monitoring, sanitary inspection, treatment records and investigation of unusual events. WHO’s sanitary inspection packages describe on site inspection as a practical way to identify risk factors that could lead to contamination and as a tool that can support water safety planning, particularly for smaller supplies. [5]
Distribution systems deserve special attention because water that has been adequately treated can deteriorate before reaching consumers. A systematic review and meta analysis of distribution system deficiencies found evidence connecting network malfunction with increased gastrointestinal illness risk, while also noting substantial differences between studies and settings. [6] Research from Hubli Dharwad in Karnataka compared continuous and intermittent piped supply and found that indicator bacteria were detected more frequently in water from intermittent supply taps, even though upstream water entering the two distribution arrangements was broadly comparable. The same study also showed an important counterpoint: household storage could cause recontamination even where supply was continuous. [7] The implication is not that every intermittent network is contaminated or that every stored sample is unsafe. Rather, hydraulic conditions, pipe integrity and post supply handling are plausible mechanisms that need direct investigation instead of assumption.
Experimental work strengthens the engineering basis for this concern but must be interpreted carefully. A 2021 study using a full scale chlorinated pipe facility examined interruptions of different durations and observed changes in turbidity, metal concentrations and microbial communities after supply resumed. [8] A 2025 pilot scale study likewise reported effects of intermittent operation on biofilm detachment and microbial characteristics. [9] These experiments help explain mechanisms that may occur inside real networks, but their numerical findings should not automatically be transferred to every Indian town or village. Pipe materials, disinfectant practices, pressure patterns, temperature, water age and surrounding contamination differ. Researchers should therefore distinguish mechanistic evidence, which demonstrates how a failure can occur, from local exposure evidence, which establishes whether it is actually occurring in the population being studied.
Where failures occur
The catchment is the first protective barrier because treatment becomes more difficult when raw water quality becomes highly variable or severely polluted. Surface sources may receive sewage, animal waste, agricultural runoff, eroded soil and urban drainage. Groundwater can contain naturally occurring substances or become affected by local sanitation, waste disposal, industrial activity or over abstraction. Catchment protection therefore reduces the burden placed on treatment rather than replacing treatment. A risk based investigation should document surrounding land use, potential pollution sources, source construction, flooding history and major seasonal changes. Where raw water quality is variable, treatment should be designed for the conditions that actually occur, including reasonably foreseeable periods of stress. WHO’s water safety planning model deliberately starts before the treatment plant because preventing contamination can be more reliable than attempting to remove every hazard after it enters the supply. [10]
Treatment creates multiple opportunities for control, but each process has operational limits. Coagulation and filtration may be affected by rapid changes in raw water turbidity. Disinfection requires appropriate treatment conditions, dosing and contact, and the presence of a treatment unit by itself does not establish performance. Operators therefore need parameters that can be checked frequently enough to warn of loss of control. Depending on the system, these may include turbidity, disinfectant residual, flow, chemical dosing, filter behaviour and equipment status. Verification through microbiological and chemical testing remains necessary, but verification and operational monitoring answer different questions. Verification asks whether the desired water quality is being achieved; operational monitoring asks whether the process that is supposed to achieve it remains under control. A sophisticated laboratory programme cannot compensate for a treatment plant that has no clear operating limits, while a well run treatment plant should still be independently verified.
Storage and distribution are often the neglected middle of the chain. Service reservoirs, overhead tanks and household tanks can become vulnerable if they are cracked, uncovered, inadequately cleaned or connected in ways that allow external material to enter. Distribution pipes may be affected by physical leaks and by hydraulic conditions that permit intrusion when pressure falls. When water service is intermittent, the network repeatedly moves between pressurised and non pressurised states. If a damaged pipe lies in contaminated soil or near leaking drains, low pressure can create a pathway by which external material may enter. The strength of this mechanism depends on local circumstances and cannot be inferred merely from the existence of an intermittent timetable. Consequently, field studies should place pressure measurements, pipe condition observations, rainfall information and microbiological sampling on the same timeline. This helps distinguish a coincidental positive sample from a repeatable network problem.
| Stage | Illustrative hazard | Control | Useful evidence |
|---|---|---|---|
| Catchment | Wastewater, runoff, flooding or hazardous land use | Source protection and pollution control | Sanitary survey, land use map, raw water trends |
| Treatment | Process failure or inadequate treatment for actual raw water | Validated processes and operating limits | Turbidity, dosing, residuals, maintenance and verification tests |
| Storage | Ingress, poor cleaning or unsafe access | Secure construction and routine inspection | Inspection records and before and after storage samples |
| Distribution | Leakage, intrusion, low pressure or cross connection | Pressure management, repair and network integrity | Pressure logging, residual monitoring, pipe failure records |
| Household | Unsafe storage, handling or unsuitable point of use device | Safe storage, validated treatment and user practice | Point of use sampling, observation and user interviews |
Seasonal and small supply risks
Drinking water systems operate in an environment that changes through the year. Heavy rainfall can increase runoff, sediment and microbial loading in surface sources and may overwhelm local drainage or sanitation infrastructure. Dry periods can reduce available water, increase water age, change source selection or concentrate some dissolved substances. Groundwater quality can also vary with hydrogeology, pumping patterns and recharge. A research programme based only on samples collected during one convenient month may therefore provide an accurate description of that month while providing a poor description of annual risk. Seasonality should be treated as part of study design, not as a statistical inconvenience discovered after sampling has finished. At minimum, researchers should record date, recent rainfall, source condition, interruptions, unusual maintenance and any temporary change in supply. Event based sampling after flooding, repair, prolonged shutdown or sudden source change can complement routine calendar based sampling.
Climate variability adds another layer. WHO guidance on climate resilient water safety planning recommends that water suppliers consider how changing climatic conditions and extreme events may affect both water quality and water quantity. [11] The purpose is not to attribute every abnormal result to climate change. The stronger approach is to identify specific pathways, such as more frequent high turbidity events, longer dry periods, flood exposure of wells or interruptions caused by power and infrastructure stress, and then determine whether existing controls can cope with those events. A research project can therefore use scenarios rather than broad predictions. For example, investigators may ask whether a treatment process remains within operating limits when raw water turbidity reaches the upper range observed during intense rainfall, or whether emergency storage remains protected during a three day supply interruption. Such questions produce evidence that can guide investment.
Small water supplies face a different but equally important challenge: the control measures must be maintainable with the personnel, finance and technical support that actually exist. WHO’s 2024 guidance specifically recognises that small supplies frequently experience operational, managerial, technical and resourcing difficulties. [2] A complex instrument that cannot be calibrated locally, a filter whose media cannot be replaced, or a treatment process that depends on continuous specialist supervision may fail despite impressive initial performance. Sanitary inspection becomes especially valuable because it can identify priority defects using a structured field assessment without pretending to replace laboratory testing. The governing principle should be progressive improvement with reliable controls. A modest system with clear inspection, maintenance and escalation arrangements may protect consumers more consistently than an elaborate installation that becomes non functional after the project team leaves.
Methodological caution
A wet season result and a dry season result should not automatically be treated as evidence of a seasonal effect. Differences may arise from source switching, sampling time, treatment performance, laboratory variation or network conditions. Repeated observations and contextual records are needed before attributing change to season.
The Indian monitoring context
In India, drinking water investigations should distinguish between legal or programme compliance and research assessment. The Bureau of Indian Standards, or BIS, standard IS 10500 is the central technical reference for drinking water specification. BIS laboratory listings continue to identify IS 10500:2012 as the Drinking Water Specification, Second Revision, while government programme material refers to the standard as amended from time to time. [12] [13] For that reason, a researcher should not copy a table of limits from an old dissertation, textbook, website or laboratory leaflet and describe it as the current legal position. Before issuing a formal compliance conclusion, the researcher should verify the current edition, amendments, sampling requirements, analytical procedures, acceptable and permissible limits where relevant, and the regulatory or programme context in which the result is being interpreted. Accreditation and laboratory scope should also be checked where an official compliance claim is intended.
The Jal Jeevan Mission provides an important institutional framework for rural drinking water service, including source sustainability, treatment, distribution, water quality laboratories, testing, surveillance and community capacity building. Its Drinking Water Quality Monitoring and Surveillance Framework distinguishes laboratory based water quality monitoring from community level surveillance and incorporates elements such as laboratory systems, Field Test Kits, digital governance, training and identification of water quality hotspots. [14] Jal Jeevan Mission advisories also direct attention to BIS IS 10500, water quality testing, monsoon surveillance, regular disinfection, remedial action and laboratory practices. [15] This is useful for research because it demonstrates that the national policy architecture already recognises that water safety involves more than collecting occasional samples. It connects technical testing with local surveillance and corrective action.
The distinction between monitoring and surveillance is particularly useful for institutional studies. Laboratory monitoring can provide analytical measurements of selected parameters under controlled procedures. Community surveillance can identify changes in source condition, visible defects, unusual taste or appearance, breakdowns and potential contamination pathways requiring further examination. Neither should be treated as a substitute for the other. Field Test Kits may help communities screen specified parameters, but a screening result should be used according to the kit’s validated purpose and programme instructions. A field observation that suggests contamination may require confirmatory laboratory testing. Likewise, a compliant laboratory result should not cause an obvious sanitary defect to be ignored. The strongest Indian monitoring model is therefore an integrated chain of observation, testing, verification, reporting and remedial action.
Compliance statement discipline
An academic paper should state the exact standard or programme document used, the version or amendment status verified at the time of analysis, the sampling method, the laboratory method and the location represented by the result. Statements such as “the village water is safe” are ordinarily too broad when only a small number of samples have been tested.
Academic and operational measures
A credible investigation should begin jointly with the people who operate the system. Researchers can draw a source to tap map with engineers, laboratory staff, local operators and community representatives. The map should identify normal flow paths and abnormal arrangements used during shortage, maintenance or breakdown. Sampling locations can then be selected deliberately rather than merely according to convenience. A useful design commonly includes raw source water, water immediately after major treatment, water after storage and representative distribution or household points. Where the question concerns network deterioration, paired upstream and downstream samples are more informative than unrelated samples from many locations. Where household handling is the research question, water from the tap can be compared with stored drinking water from the same household. The objective is to create comparisons capable of locating change, not simply to maximise the number of bottles sent to a laboratory.
Contextual records should accompany every sample. Date and time, sample point, source in use, recent rainfall, service interruption, pressure condition, disinfectant information, recent repairs and unusual operational events can be recorded in a standard field form. Chain of custody procedures and preservation requirements should be appropriate to the analysis. Researchers should also separate screening, operational monitoring and confirmatory testing in their database because these observations may not have equivalent analytical precision. Quality assurance is essential. Duplicate samples, blanks, calibration records, proficiency testing information and laboratory accreditation scope may be relevant depending on the purpose of the study. An apparently precise dataset can still produce weak conclusions if sampling times were inconsistent, methods changed midway through the project or missing values were silently treated as negative results.
Operational systems require a response rule as much as a testing schedule. Before data collection begins, institutions should decide what happens when a parameter falls outside an operating limit, when a microbial indicator is detected, when pressure collapses, when a tank inspection reveals contamination risk or when users report an unusual event. The correct response depends on the hazard and competent public health guidance, but responsibility should not remain vague. There should be a named reviewer, verification process, escalation pathway, corrective action record and closure criterion. A dashboard that displays failures without assigning action is an information system, not a control system. Likewise, repeatedly sampling a defective point without repairing the underlying cause can create the appearance of monitoring while leaving exposure unchanged. The meaningful performance indicator is not merely how many tests were completed, but how effectively recognised risks were resolved and kept under control.
Useful for measuring activity, but it does not show whether detected failures were corrected.
Measures how quickly an abnormal result or operational failure reaches the responsible decision maker.
Examines whether corrective action produces continuing improvement at the relevant consumer or system point.
Major debates and competing viewpoints
More testing or better infrastructure?
The apparent choice between testing and infrastructure is often framed too sharply. Testing cannot seal a broken tank, maintain positive network pressure or repair a leaking pipe. Infrastructure investment, however, cannot demonstrate that the intervention is working unless performance is monitored. The appropriate balance depends on the diagnosed problem. If sanitary inspection identifies an open storage reservoir beside an obvious contamination source, immediate physical protection may deserve priority over an elaborate expansion of routine sampling. If repeated complaints occur only after heavy rainfall but the pathway is unclear, targeted source, treatment and network monitoring may be necessary before major capital expenditure is chosen. In both situations, follow up testing is required to determine whether the corrective action worked. Testing is strongest when it informs decisions, and infrastructure is strongest when its performance can be verified. The system map therefore provides a more rational basis for resource allocation than choosing between laboratory expenditure and engineering expenditure in the abstract.
Can household filters compensate for weak public supply?
Household treatment may reduce specific exposures when the technology is independently validated for the relevant hazard and is operated correctly. It can be especially important as an interim risk reduction measure where central systems cannot immediately provide adequate protection. However, household treatment transfers responsibility for operation, replacement, cleaning and verification to users who may have unequal resources and information. Different devices remove different hazards, and a filter designed for turbidity or particular microorganisms should not be assumed to remove arsenic, fluoride, dissolved salts or every chemical contaminant. Storage after treatment may also reintroduce contamination. Household devices therefore need to be evaluated as a defined treatment barrier rather than as a general symbol of safety. A point of use intervention can supplement public system protection but should not conceal a preventable failure in source protection, treatment, storage or distribution.
Is continuous supply automatically safe?
Continuous pressurised service can reduce some mechanisms associated with intermittent operation, but continuity alone does not guarantee safe water. A continuously operated network can still contain cross connections, deteriorated mains, excessive water age, inadequate disinfectant residual or contamination introduced after the household tap. The Karnataka study that found better microbial results in the continuously supplied distribution zone also documented recontamination during household storage. [7] The appropriate conclusion is therefore narrower than saying “continuous supply equals safe supply.” Continuous service may remove or reduce specific hydraulic and storage related risk pathways, while the remaining barriers still require management. This distinction matters for policy evaluation because conversion to continuous service should be assessed through pressure, leakage, water quality, user behaviour and maintenance outcomes rather than by service hours alone.
Should advanced sensors replace conventional sampling?
Online sensors can provide high frequency information on pressure, flow, turbidity, conductivity, disinfectant residual or other operational variables. Their major advantage is temporal resolution: an abnormal event lasting twenty minutes may never be captured by a monthly grab sample. Their limitation is that sensors usually measure selected indicators rather than every health relevant contaminant. Sensors also require calibration, maintenance, data validation and reliable interpretation. Accordingly, advanced monitoring is best seen as part of a tiered system. Continuous measurements can identify unusual conditions and trigger investigation, while laboratory analysis verifies specific contaminants and supports compliance assessment. The relevant question is not whether digital technology appears modern, but whether the additional data shorten detection time, improve diagnosis and lead to corrective action. Technology that creates thousands of alerts without operational response may increase information while producing little public health benefit.
Institutional testing framework
Universities, water utilities, local bodies and public health agencies can use a common staged framework so that field investigation moves logically from understanding the system to correcting risk. The stages below are deliberately simple. They can be adapted to a village scheme, campus supply, municipal network or institutional water system. The crucial requirement is that each stage produces evidence that is usable by the next stage. Mapping should guide sampling, baseline information should guide priorities, priorities should determine controls, verification should test whether those controls perform, and the response system should close the loop when performance is inadequate. A monitoring programme should therefore be designed backwards from the decisions that somebody must eventually make.
| Stage | Core question | Minimum evidence | Decision produced |
|---|---|---|---|
| Map | Where can water quality, quantity or continuity change? | Source to consumer map, asset information and operator interviews | Priority points for inspection and measurement |
| Baseline | Which hazards are plausible and which are actually detected? | Sanitary inspection, historical records and seasonal sampling | Risk ranking and uncertainty statement |
| Control | Which barrier addresses each priority hazard? | Treatment design, operating criteria, maintenance records and responsibilities | Operational control plan |
| Verify | Does the barrier work under ordinary and stressed conditions? | Repeated measurements, point of use results and failure logs | Evidence of effectiveness or need for modification |
| Respond | Who acts when a control or test fails? | Escalation record, corrective action, communication and closure verification | Resolved risk or formally escalated unresolved risk |
A structured evaluation protocol
Research opportunities
Indian universities can contribute substantially by studying the places where routine monitoring and system operation intersect. One useful design is a longitudinal source to tap study covering pre monsoon, monsoon and post monsoon periods. Samples can be paired with sanitary inspection, rainfall, service interruption, treatment records and household storage observations. Such a study would be stronger than merely comparing seasonal average concentrations because it could examine mechanisms. Another project could place pressure loggers at selected distribution points and test whether low pressure episodes correspond with changes in turbidity, disinfectant residual, microbial indicators or consumer complaints. A third project could compare a sanitary inspection score with laboratory outcomes over time to determine whether visible defects provide an early warning of future water quality failures. These questions are academically publishable while also producing information that operators can use.
Interdisciplinary collaboration is especially valuable. Environmental scientists and microbiologists can design analytical protocols, civil engineers can interpret hydraulic behaviour and treatment performance, geographers can map catchments and contamination sources, public health researchers can examine exposure and disease surveillance, social scientists can study household storage and risk perception, and legal scholars can analyse institutional duties, standards, accountability and access to information. The most useful projects should avoid treating communities merely as sources of samples. Residents often know when supply patterns changed, which alternative source is used during breakdown, which pipes frequently fail and how storage practices respond to unreliable service. These observations can generate hypotheses that are then tested objectively. At the same time, interview evidence should not be confused with laboratory proof. Triangulation is valuable precisely because different forms of evidence answer different questions.
High value university research gaps
Priority studies include seasonal source to tap contamination pathways, intermittent supply and pressure loss, household storage recontamination, effectiveness of sanitary inspections, performance of low cost sensors, treatment resilience during extreme raw water events, institutional response time after failed tests, communication of water quality information, and long term maintenance of small supply technologies after project funding ends.
Research should also evaluate interventions rather than merely diagnose problems. Suppose a campus finds that rooftop storage tanks are a repeated contamination risk. The research opportunity is not finished when the defect is reported. Investigators can document baseline conditions, introduce a standardised inspection and cleaning schedule, improve tank protection, train responsible staff and then compare subsequent results with the baseline. Where feasible, a controlled before and after design can strengthen causal interpretation. Similar approaches can evaluate network flushing protocols, revised disinfection procedures, source protection work or digital maintenance systems. The study should identify alternative explanations and avoid claiming that an intervention caused improvement when seasonal changes, source switching or altered laboratory procedures could also explain the result. Good applied research therefore joins practical usefulness with methodological caution.
Future directions
Future water safety systems will probably use more frequent operational data, but the main innovation should be better decision making rather than simply more instrumentation. Low cost pressure sensors, turbidity meters, digital chlorine monitoring, remote pump status and maintenance applications can create a near real time picture of system behaviour. Event based sampling can then be activated when predefined conditions occur, such as prolonged low pressure, an intense rainfall episode, an unusually high turbidity reading, a major pipe repair or an unexpected loss of disinfectant residual. This approach increases the chance of observing the conditions under which failure actually happens. The central research question should remain practical: does earlier detection produce earlier and more effective control? If digital monitoring produces alarms that are routinely ignored or generates data that cannot be maintained after project funding ends, the technology has not solved the institutional problem.
WHO’s updated 2026 Guidelines for Drinking Water Quality reinforce risk management from catchment to consumer and include stronger attention to small water supplies, government support and the use of both water quality testing and risk management information when prioritising action. [1] This direction supports a future in which compliance testing remains necessary but becomes one part of a wider evidence system. Data platforms can combine laboratory results, sanitary inspection findings, treatment records, service continuity, complaints and infrastructure incidents. Machine learning and automated anomaly detection may eventually help identify patterns, but algorithms should not be allowed to conceal data quality limitations or replace professional judgement. A model trained on incomplete or unrepresentative observations may confidently produce the wrong priority. Transparent rules and interpretable alerts are particularly important in public health systems where decisions need to be explained and audited.
Climate adaptation will also move water safety planning beyond historical averages. Infrastructure is normally designed using past conditions, yet future reliability may depend on performance during uncommon rainfall, longer dry spells, higher source variability, floods and compound infrastructure failures. Scenario testing offers a practical response without pretending to predict exact future conditions. Water suppliers and researchers can identify a small number of plausible stress situations and ask whether source capacity, treatment, storage, electricity, chemical supply, staffing and emergency communication remain adequate. The outcome should be a prioritised adaptation plan rather than a broad statement that climate change is a threat. Resilience becomes measurable when institutions can identify a foreseeable abnormal condition, maintain or restore safe service and learn from the event.
Conclusion
Drinking water safety is best understood as a chain of barriers that must remain effective from catchment to consumer. Laboratory testing is indispensable because it provides direct evidence about selected characteristics of a sample, but a sample alone cannot describe every condition through which the water has travelled or every condition that will occur before the next test. Source protection, treatment operation, secure storage, distribution integrity, household practices, sanitary inspection and institutional response therefore belong to the same analytical framework. Evidence from WHO guidance, global service monitoring, Indian water quality programmes and peer reviewed distribution research supports a preventive and risk based approach in which testing verifies performance while operational information helps explain failure. The objective is not to collect the greatest possible volume of data; it is to identify risk early enough to prevent exposure and to confirm that corrective action has worked.
For India, the practical opportunity is to connect existing standards, laboratory infrastructure, community surveillance and water service management more closely. Academic institutions can strengthen this process by conducting seasonal and event based source to tap studies, analysing intermittent supply, evaluating household storage, testing the predictive value of sanitary inspections and studying whether digital monitoring actually improves response. Researchers should be disciplined about the limits of inference. A positive sample does not automatically locate the source of contamination, a negative sample does not prove permanent safety, a field kit is not interchangeable with every laboratory method, and a technological intervention is not successful merely because it was installed. A safe water system is one in which hazards are understood, controls are maintained, failures are detected, responsibility is clear and corrective action can be demonstrated. That systems perspective turns isolated testing into sustainable public health protection.
Reports and Research Sources
- World Health Organization. Guidelines for drinking-water quality: fourth edition incorporating the first, second and third addenda. World Health Organization, 2026. WHO publication page.
- World Health Organization. Guidelines for drinking-water quality: small water supplies. World Health Organization, 2024. WHO publication page.
- WHO/UNICEF Joint Monitoring Programme for Water Supply, Sanitation and Hygiene. Progress on household drinking water, sanitation and hygiene 2000-2024: special focus on inequalities. WHO and UNICEF, 2025. JMP report page.
- World Health Organization. Drinking-water: Fact Sheet. World Health Organization, 2023. WHO fact sheet.
- World Health Organization. Sanitary inspection packages: a supporting tool for the Guidelines for drinking-water quality: small water supplies. World Health Organization, 2024. WHO publication page.
- Ercumen, A., Gruber, J. S., and Colford, J. M. Jr. Water Distribution System Deficiencies and Gastrointestinal Illness: A Systematic Review and Meta-Analysis. Environmental Health Perspectives, 2014, 122(7), 651-660. Full text at PubMed Central.
- Kumpel, E., and Nelson, K. L. Comparing microbial water quality in an intermittent and continuous piped water supply. Water Research, 2013, 47(14), 5176-5188. Journal article.
- Calero Preciado, C., Husband, S., Boxall, J. and others. Intermittent Water Supply Impacts on Distribution System Biofilms and Water Quality. Water Research, 2021, 201, 117372. PubMed record.
- Scientific Reports. Biofilm detachment significantly affects biological stability of drinking water during intermittent water supply in a pilot scale water distribution system. Scientific Reports, 2025, Volume 15, Article 22408. Nature publication page.
- World Health Organization. Water safety plan manual: step-by-step risk management for drinking-water suppliers, second edition. World Health Organization, 2023. WHO publication page.
- World Health Organization. Climate-resilient water safety plans: managing health risks associated with climate variability and change. World Health Organization, 2017. WHO publication page.
- Bureau of Indian Standards. IS 10500:2012, Drinking Water – Specification, Second Revision. Bureau of Indian Standards. Current laboratory scope information should be checked together with applicable amendments and official standard documents. BIS Laboratory Information Management System.
- Department of Drinking Water and Sanitation, Ministry of Jal Shakti, Government of India. Jal Jeevan Mission operational terminology and reference to IS 10500:2012 as amended from time to time. Government of India. Jal Jeevan Mission reference page.
- Department of Drinking Water and Sanitation, Ministry of Jal Shakti, Government of India. Drinking Water Quality Monitoring & Surveillance Framework. Jal Jeevan Mission, 2022. Official framework PDF.
- Department of Drinking Water and Sanitation, Ministry of Jal Shakti, Government of India. Water Quality Advisories and Letters. Jal Jeevan Mission. Official advisory repository.